Power BI · SAP S/4HANA data · SODOLO Automotive
From an SAP extract to an answer on margin
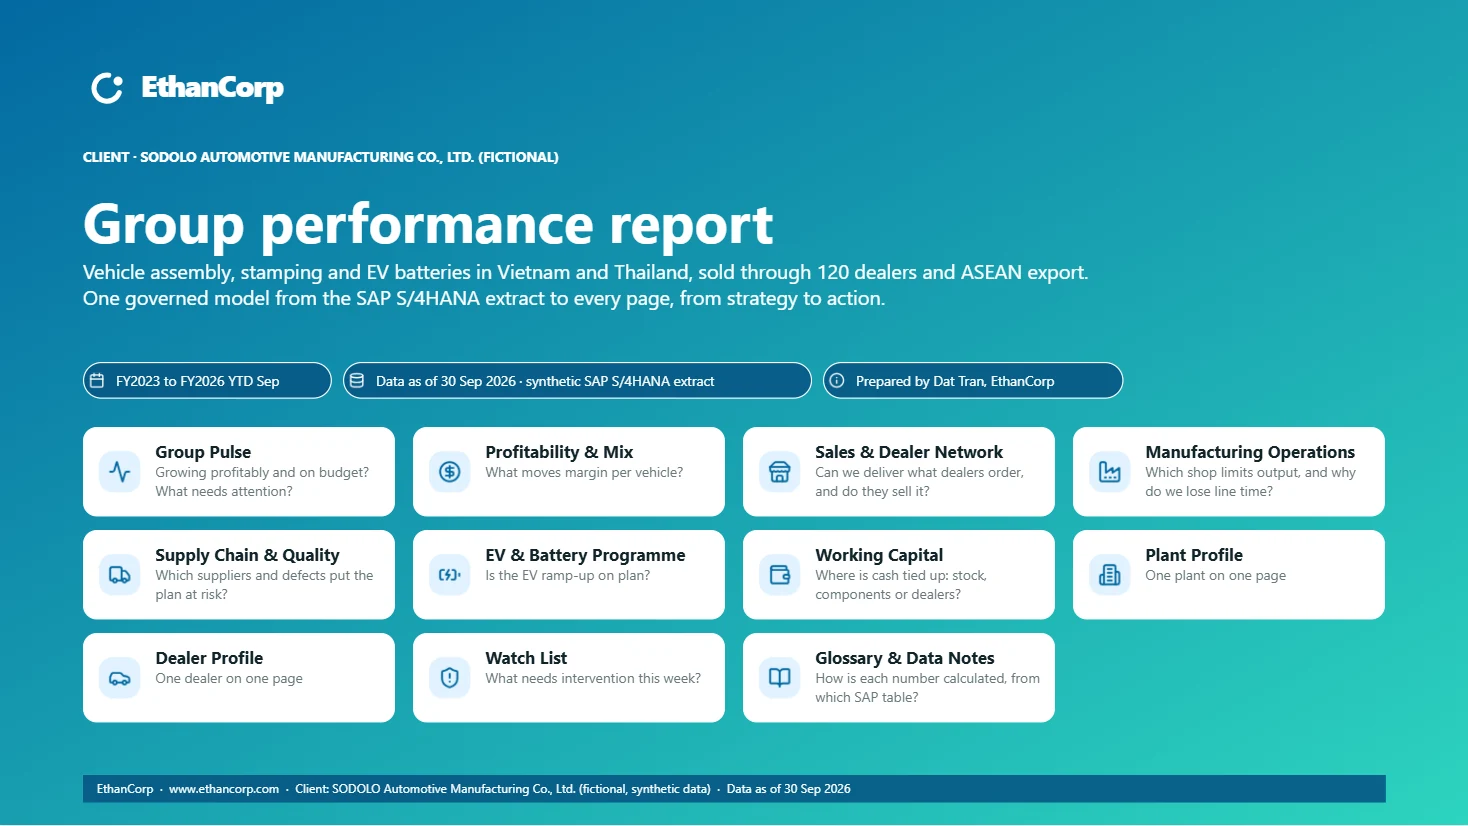
A Power BI reference build for SODOLO Automotive, a fictional carmaker whose sales grew while its margin fell. It starts from tables in SAP S/4HANA format, reconciles them to the general ledger, and shows the board, the CFO and each plant where the margin went — on synthetic data, so every page can be shown in full.
Access is by invitation. If Power BI asks you to sign in, ask me for access.
What this is, plainly
SODOLO Automotive does not exist. It is a fictional carmaker that I invented so I could build a report the way I would for a manufacturer, without exposing anyone's data. It has two plants in Vietnam that stamp, paint and assemble a sedan, an SUV, a pickup and an electric car, a battery plant in Thailand, 120 dealers and an export company. Every vehicle, dealer, supplier and dollar in it is synthetic, generated by a script, so the whole dataset can be rebuilt exactly.
The data is laid out the way SAP S/4HANA stores it: the same table and field names, the same key padding, date formats and sign conventions. It is a simulated extract, not a connection to a live SAP system. What it lets you judge is the path from those tables to a report, which is the part of the work a description cannot show.
What the report tells the leadership team
I wrote eight business stories into the data on purpose, and wrote down the answers before the report was built. The question the report has to answer is the chief executive's: are we growing profitably? Some of what it shows, as at 30 September 2026:
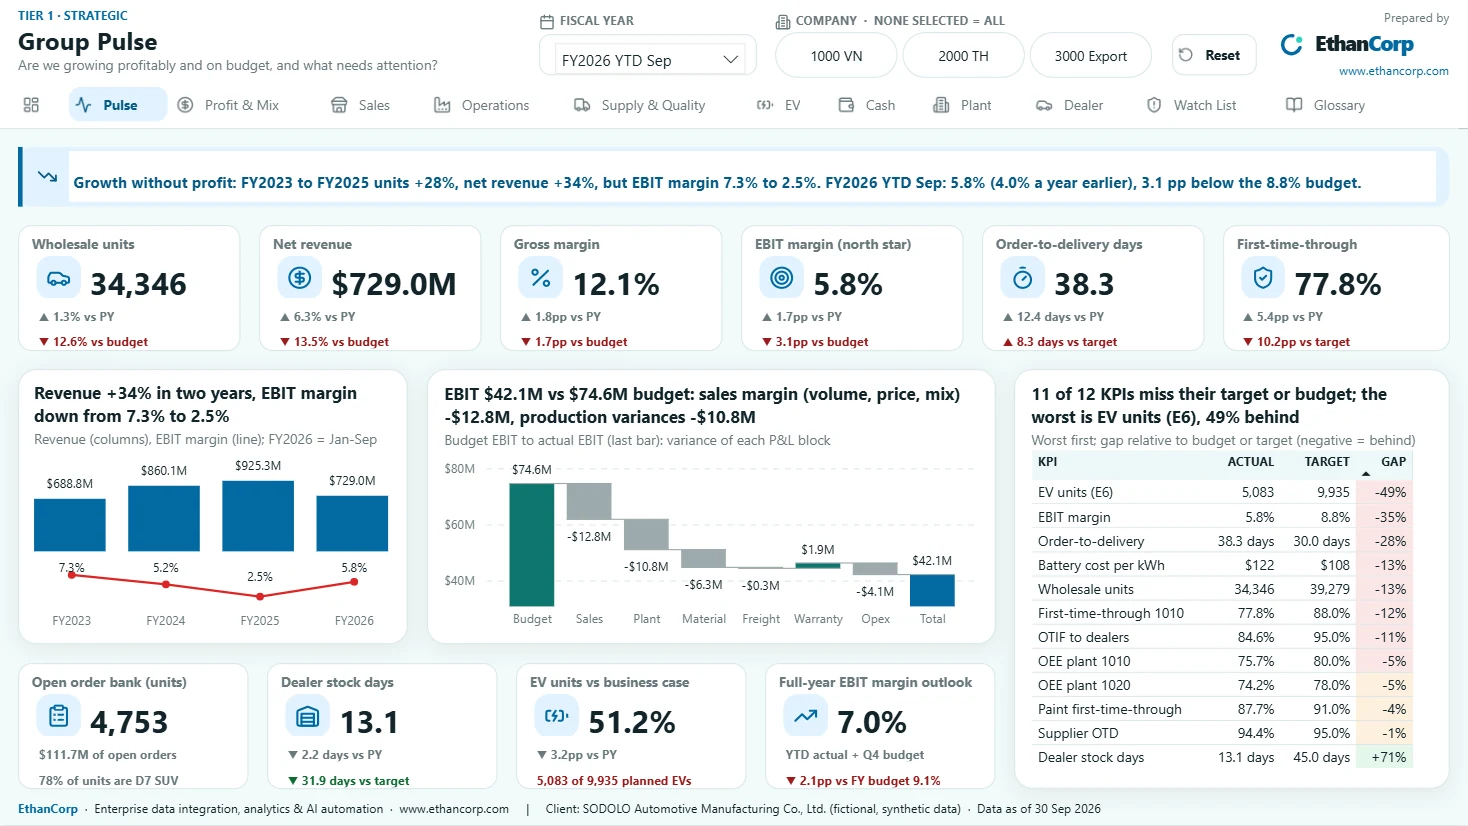
- The headline: from FY2023 to FY2025, units grew 28% and net revenue 34%, while EBIT margin fell from 7.3% to 2.5%. In the first nine months of FY2026 it is 5.8%, against a budget of 8.8%.
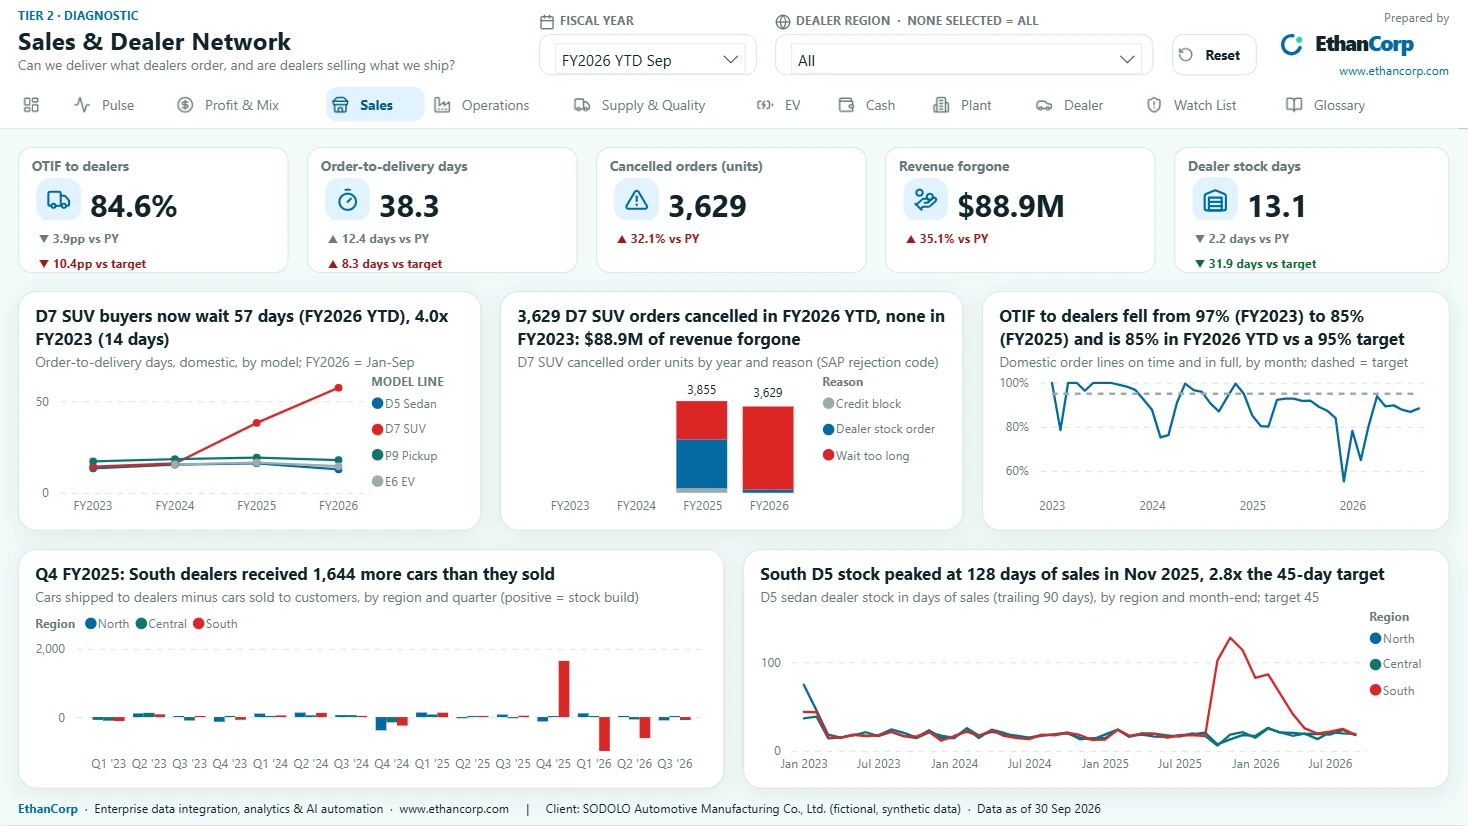
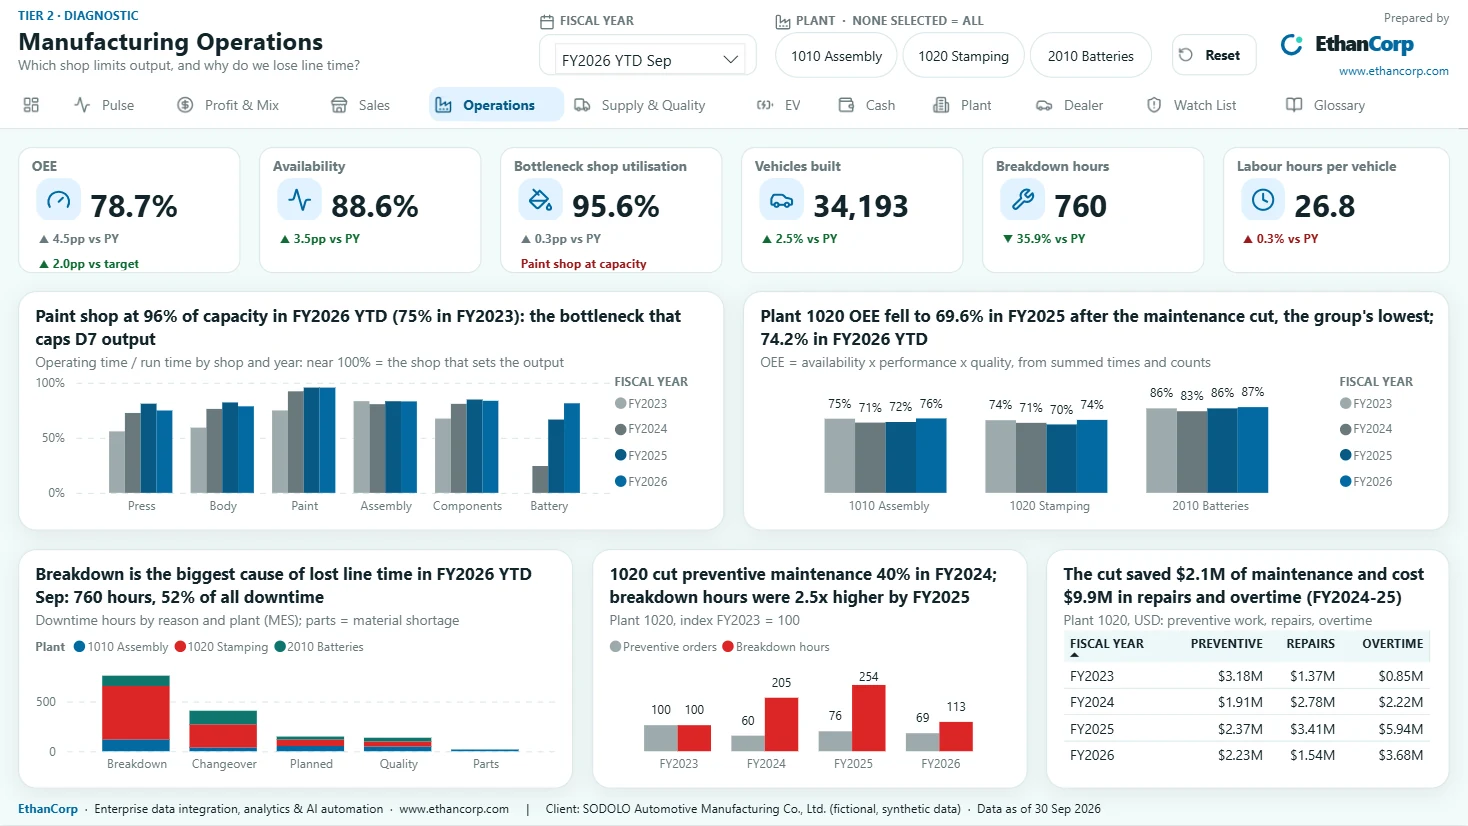
- The most profitable model is the one the plant cannot build fast enough. The paint shop runs at 96% of capacity, buyers of the D7 SUV wait 57 days, and 3,629 orders were cancelled in nine months — $88.9M of revenue forgone.
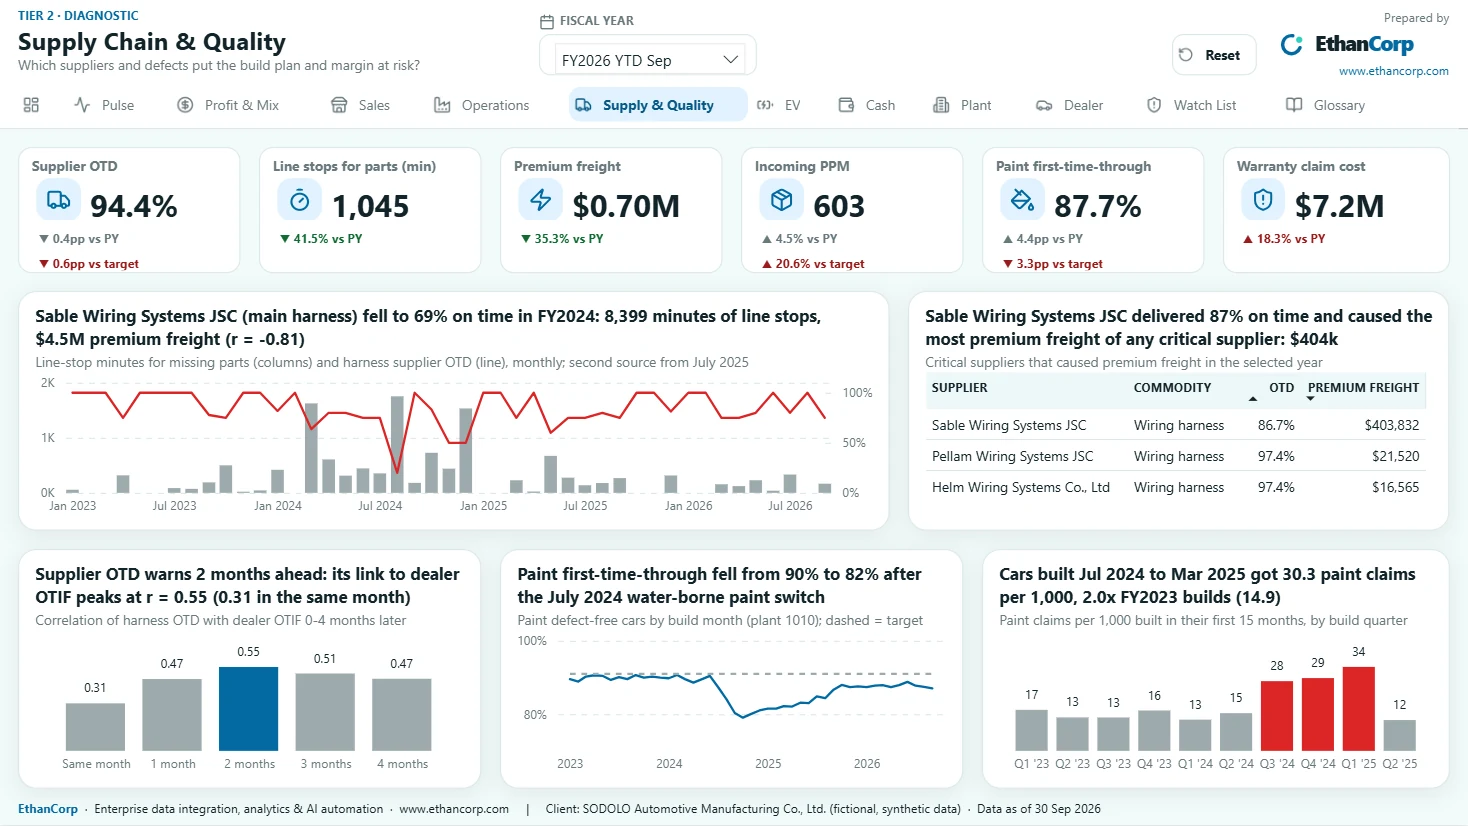
- One supplier stopped the line. The main wiring-harness supplier fell to 69% on-time delivery in FY2024, which cost 8,399 minutes of line stops and $4.5M of premium freight. Supplier delivery warns two months before deliveries to dealers slip.
- A saving that cost more than it saved. Plant 1020 cut preventive maintenance by 40% in FY2024. The cut saved $2.1M and cost $9.9M in repairs and overtime.
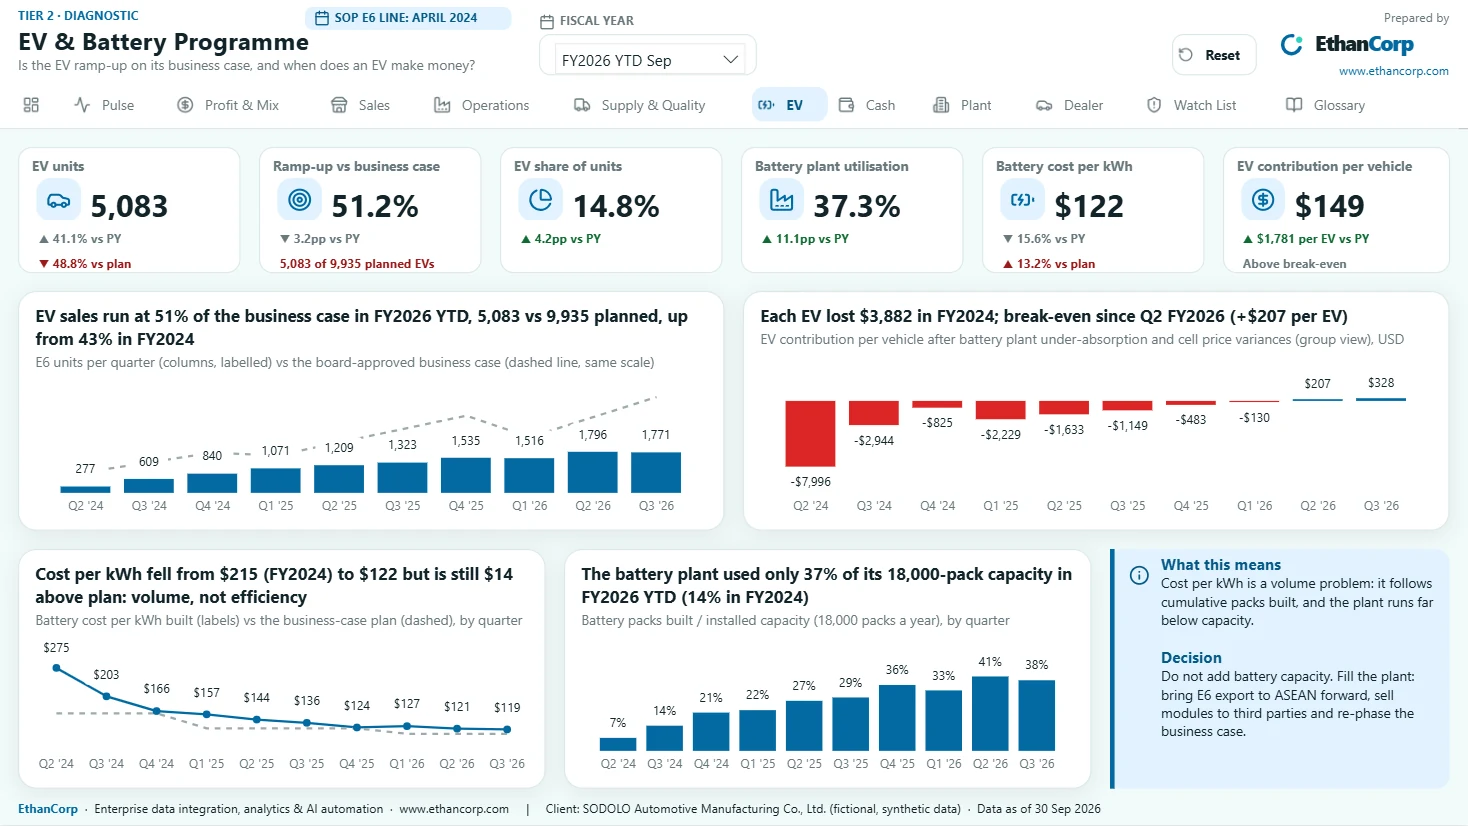
- The electric car sells at 51% of its business case, so the battery plant uses 37% of its capacity. Cost per kWh has fallen to $122 and is still $14 above plan — a volume problem, not an efficiency one.
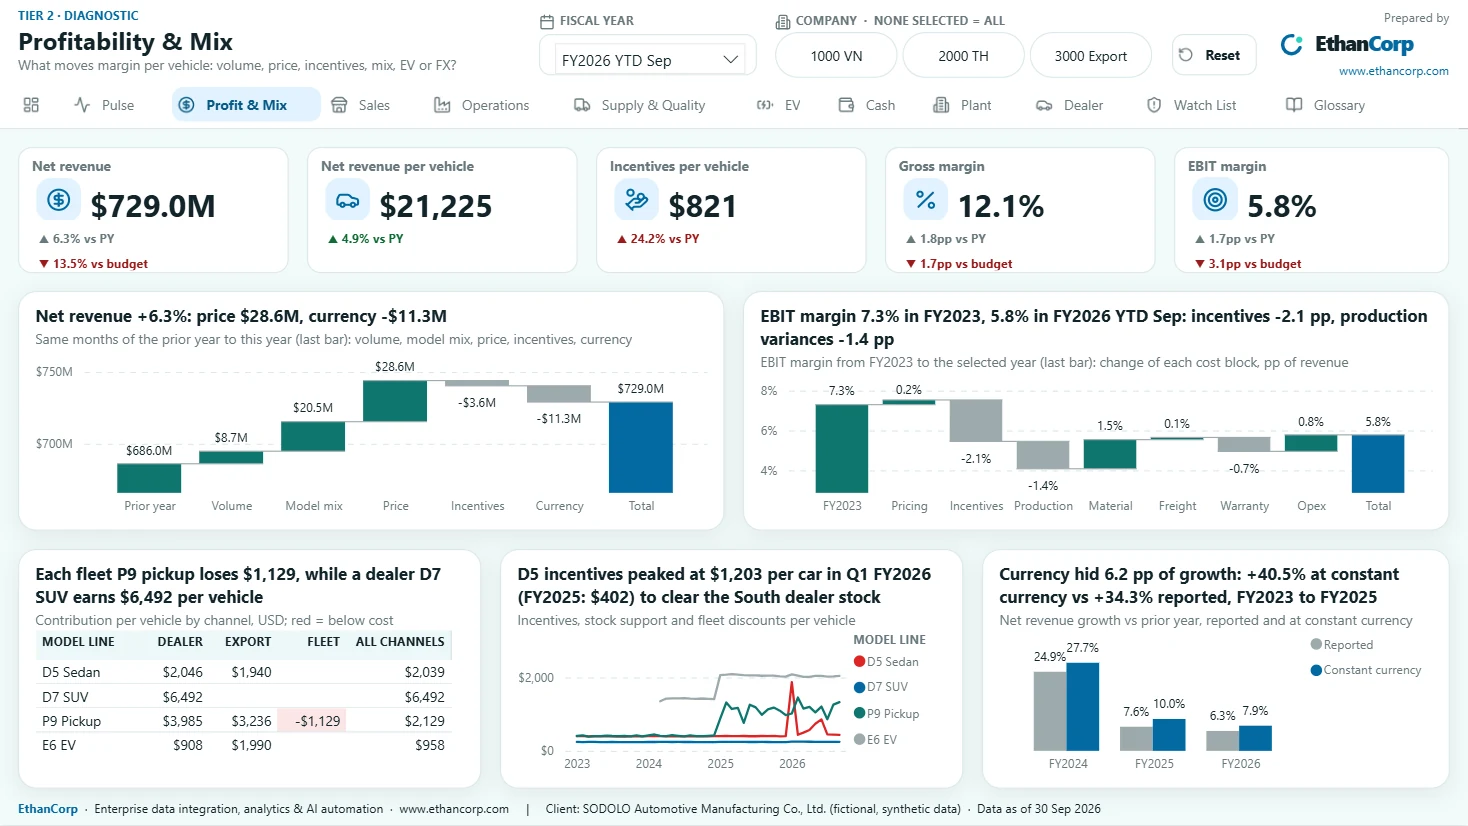
- A fleet contract added volume and lost money: each fleet pickup loses $1,129, while an SUV sold through a dealer earns $6,492.
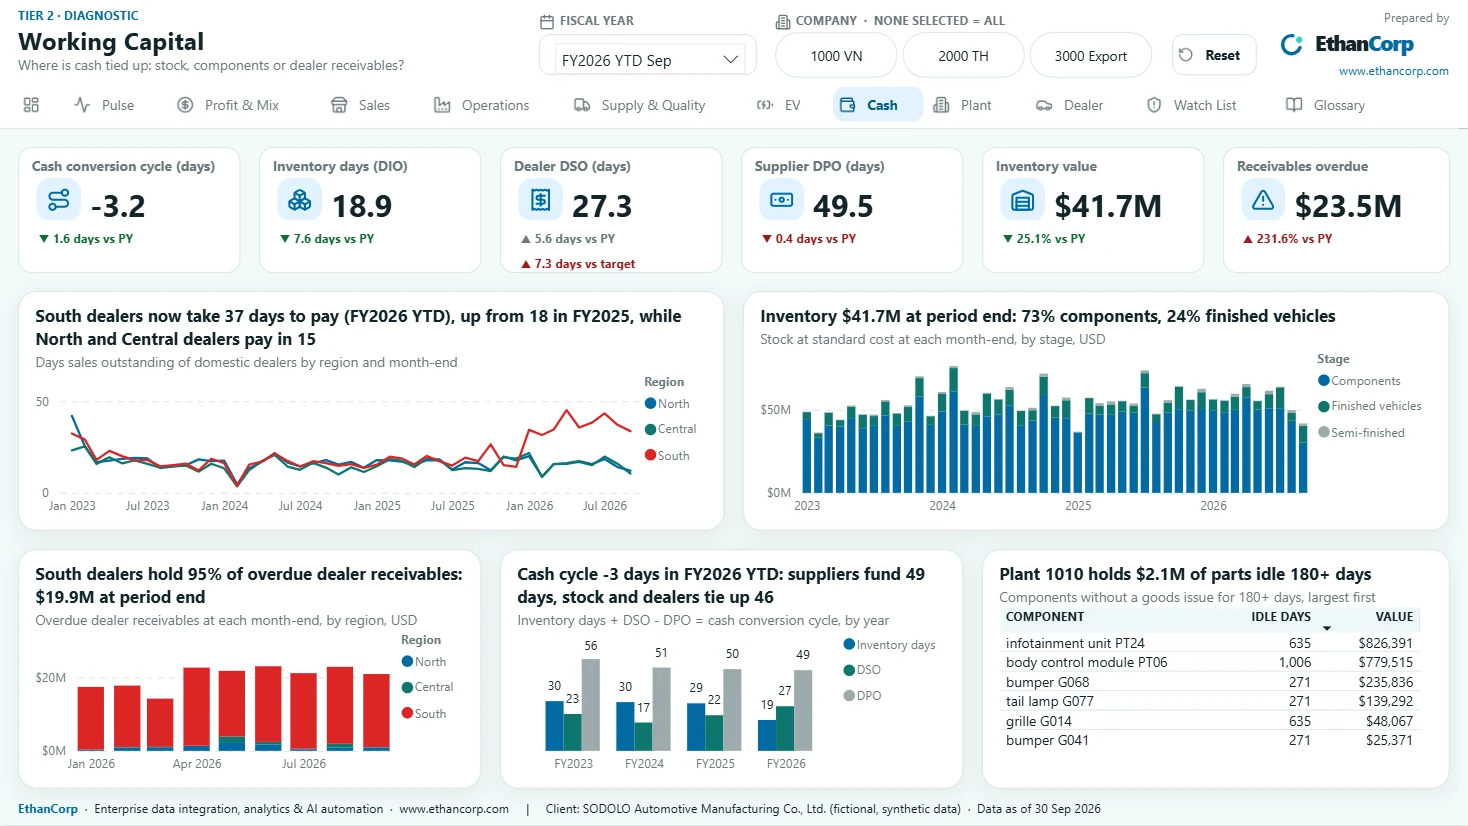
- Part of one year's volume was borrowed from the next. In the last quarter of FY2025, dealers in the South received 1,644 more cars than they sold. Their stock of the D5 sedan peaked at 128 days of sales, and they now take 37 days to pay.
From SAP tables to a number Finance can sign
Most of the work in a report like this happens before the first chart. The extract has 50 tables in SAP's own formats: keys padded with zeros, dates as eight digits, amounts stored as text, and revenue held as a negative number in the ledger. A transform turns them into a star schema of 13 dimensions and 19 fact tables that a report can read.
- Eight of the 50 tables are not SAP's own. They hold feeds from the systems around it: line downtime from the manufacturing execution system, dealer sales from the dealer management system, the vehicle register, defects and warranty claims, and targets from the planning tool. The downtime feed has its own line codes and the dealer feed its own dealer codes, so both are mapped before anything joins.
- Three currencies. The Vietnamese company keeps its books in dong, the Thai company in baht and the export company in US dollars. The group view is in dollars, and revenue is also shown at last year's exchange rates, so that currency does not pass for growth.
- Sales between group companies are removed. The Thai plant sells to the Vietnamese company and the Vietnamese company sells cars to the export company. Both are eliminated in the group view, and a check proves that the two sides net to zero.
- Eight reconciliations hold the tables together. Billed revenue, intercompany invoices, purchase price variance and warranty expense must each equal what the general ledger says. Vehicles built must equal vehicles recorded, and each dealer's closing stock must equal opening stock plus cars received minus cars sold.
- History is kept where it changes the answer. Materials and work centres keep every version of a record with its dates, so a past year is costed at that year's standard cost and measured against that year's line capacity.
What this proves, and what it does not
Because I planted the stories, this shows that the report can bring a known answer to the surface, and that the path from SAP-format tables to that answer is tested from end to end. It does not show that the same transform would run unchanged on your system. Every SAP installation has its own custom fields, its own configuration and its own history of exceptions. Extracting from a live system — which interface, how often, with whose approval — is a project decision this build does not make.
How the report is organised
The report follows the same rules as the SenMinh reference build: every page prints the business question it answers, every chart title states its conclusion, and no number appears without a comparison. What is particular to this one:
- Three tiers. One page for the board; six that each diagnose one branch of the margin — profitability, sales and dealers, manufacturing, supply chain and quality, the electric-vehicle programme, working capital; and three for action: a profile of one plant, a profile of one dealer, and a watch list.
- Like for like. FY2026 has nine months, so it is always compared with the same nine months of FY2025 and with the budget to September, never with a full year.
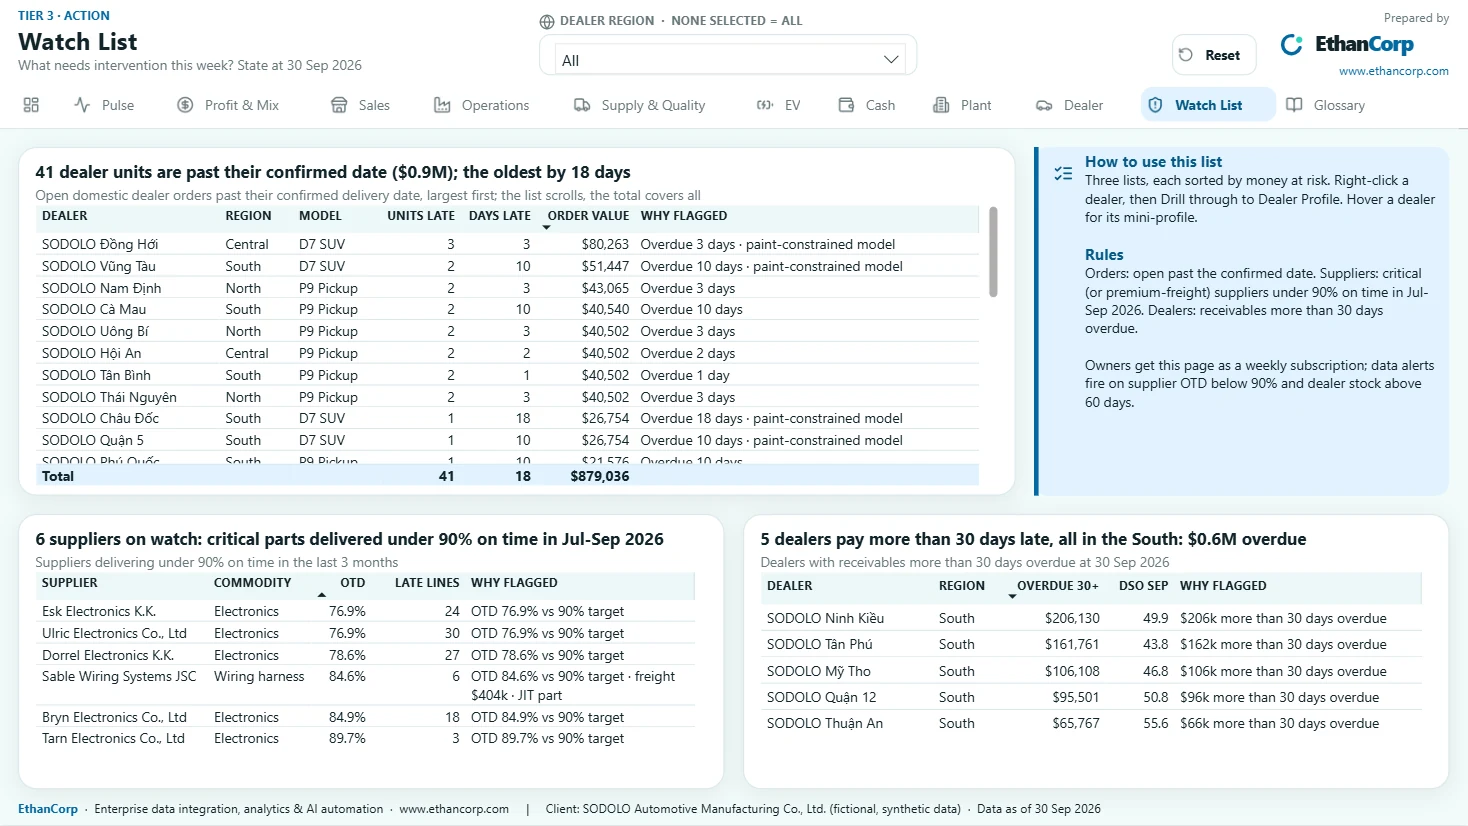
- A watch list with a reason on every row: 41 vehicles on dealer orders past their confirmed date, 6 suppliers delivering under 90% on time, 5 dealers more than 30 days overdue.
- One report for every audience. A plant director sees one plant, a sales director one company, an area manager one dealer region, and the board the whole group.
Inside the report
Ten pages, as rendered.
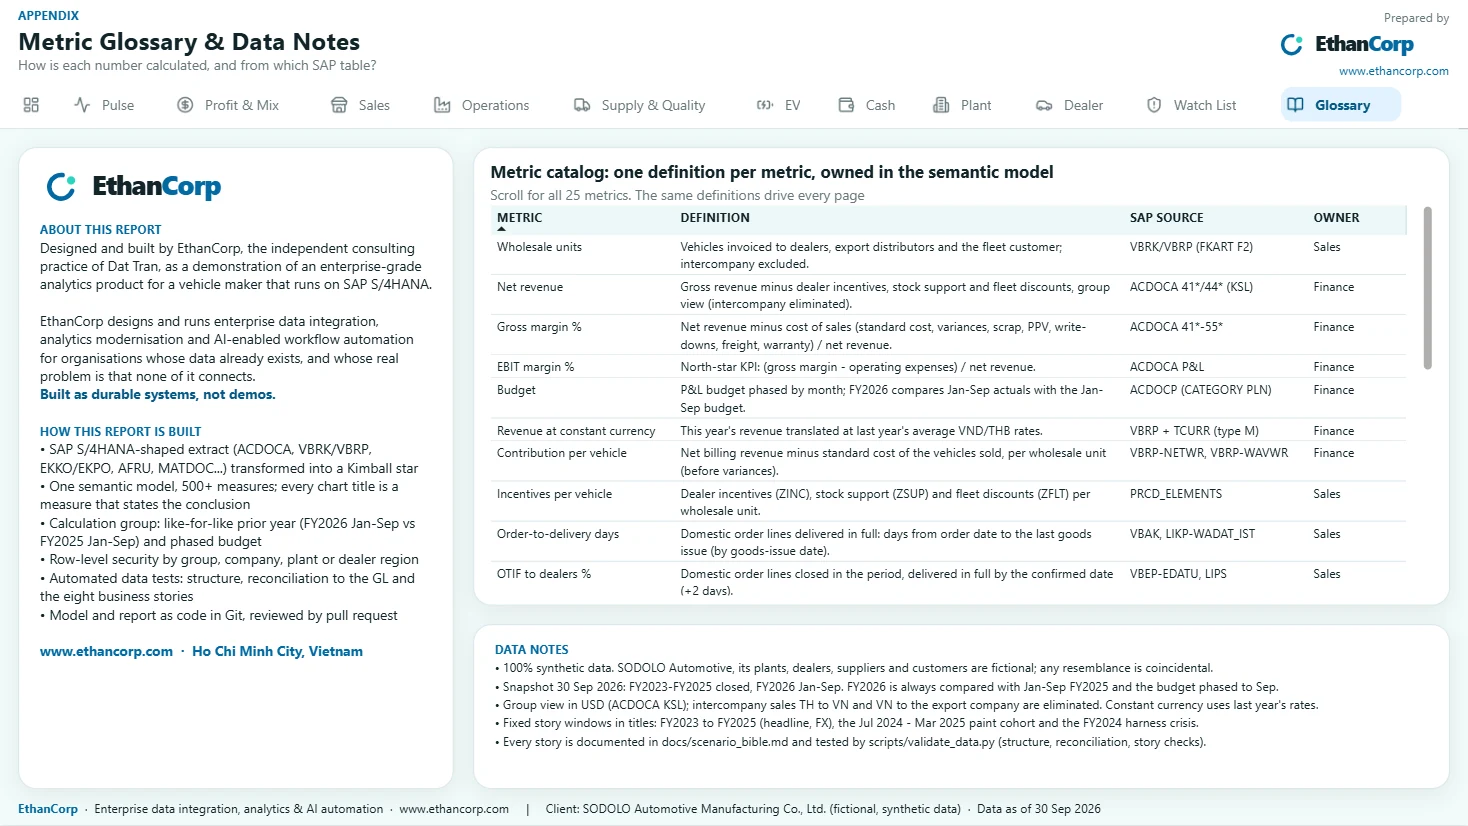
Captured in Power BI Desktop with FY2026 to September selected, all companies. Every page carries a footer stating that the client is fictional and the data synthetic. Select an image to open it at full size.
Outcome
What the build delivers.
For technical readers
How it was built.
The data layer, the model and the report as code, and the checks every change had to pass.
Every layer is a script
Nothing in the report was built by dragging visuals onto a canvas. Claude Code wrote Python that generates each layer as text files: the SAP-format extract, the transform to the star schema, the semantic model as TMDL and the report as PBIR. Rebuilding any layer is a script run, and every change is a reviewable diff in Git.
- Data: a generator in which the tables are linked by cause and effect — supplier delivery drives line stops, line stops drive late deliveries to dealers, paint rework takes capacity from the model in highest demand. It writes 50 tables and about 2.6 million rows, the same on every run.
- Star schema: 13 dimensions and 19 fact tables joined on surrogate keys, with full history on two dimensions.
- Semantic model: 42 tables, 83 relationships, 544 measures in display folders that follow the KPI tree, dynamic row-level security at group, company, plant and dealer-region level, and a Time Comparison calculation group that gives every KPI its prior-year and target comparison.
- Report: 12 pages and 3 tooltip pages on the EthanCorp design system. Chart titles are measures, so the sentence above a chart changes with the year selected.
- Verification: 122 data checks, the PBIR validated against Microsoft's published JSON schemas, the model loaded through the Tabular Object Model, and Power BI Desktop opened, refreshed and captured page by page for review. Twelve business questions were then checked against the screenshots; each is answered within three clicks of the cover.
- Process: one feature branch per phase, 33 commits between 9 October and 9 November 2026.
Constraints
- The extract is simulated. Getting data out of a live SAP system — the interface, the schedule, the authorisations — is not exercised here, and on a real project it is a large part of the work.
- Synthetic data is cleaner than real data. The awkward parts were written in on purpose: cancelled invoices and their reversals, credit memos, deletion flags, year-end write-downs. They are the ones I thought of, not the ones a real system would surprise me with.
- The twelve questions were checked by the assistant against screenshots, not by people who did not know the answers. Until a real viewer has run them, the claim is that the answers can be found, not that people find them.
- Access by role is defined for fourteen invented users. How it maps to real accounts is decided when a report is deployed for an organisation.
- The published copy on the Power BI Service opens only for people I have given access to.
Lessons
What I would tell the next team.
- Reconcile to the ledger before you draw anything. A margin report that Finance cannot tie to the general ledger gets argued about, not used, and the argument is cheaper to settle in a script than in a board meeting.
- Put the leading indicator next to the result. Supplier delivery moved two months before deliveries to dealers did, and the maintenance budget was cut a year before the breakdowns peaked. A report that shows only the result tells you what has already been lost.
- Model the chain of cause, not the source tables. The stories here cross purchasing, production, sales, warranty and finance. A report organised as one page per SAP module would have every number and none of the causes.

Dat TranEnterprise Data & AI Analytics Architect — the person behind EthanCorp.
Questions
Common questions about the SODOLO report.
Can I open the report?
It is published on the Power BI Service, and access is by invitation. If you would like to explore it, ask through the contact page and I will share it with you.
Is this connected to a real SAP system?
No. The data is synthetic and laid out in SAP S/4HANA table and field formats. On a real project the extract comes from your system through an interface agreed with your SAP team, and the transform is adapted to your configuration and custom fields.
Could EthanCorp build this on our data?
Yes — that is the service this demonstrates. On real data the work usually starts with a fixed-scope review: the Integration & Migration Review for the source side, or the KPI Definition Audit for the definitions. That is where real projects spend their time, and where synthetic data cannot help.
Have a data, analytics or automation problem that should not need another workaround?
Tell me what is breaking and what you have already tried. If EthanCorp is not the right fit, I will say so and point you somewhere better.
- Response time
- Within two business days
- Based in
- Ho Chi Minh City, Vietnam — working across Asia and remote